


1. CONNECTION FREQUENCY SCORE
WHAT IT MEASURES:
- How often team members have spontaneous conversations
- Cross-departmental interaction rates
- Voluntary vs. scheduled communication balance
HOW BUMPCALL TRACKS IT:
- Number of organic conversations initiated per week
- Response rates to spontaneous connection opportunities
- Time between connections (are relationships sustained?)
BUSINESS IMPACT:
- Teams with higher connection frequency show 35% better retention
- Correlates directly with innovation rates and problem-solving speed
DASHBOARD VIEW:
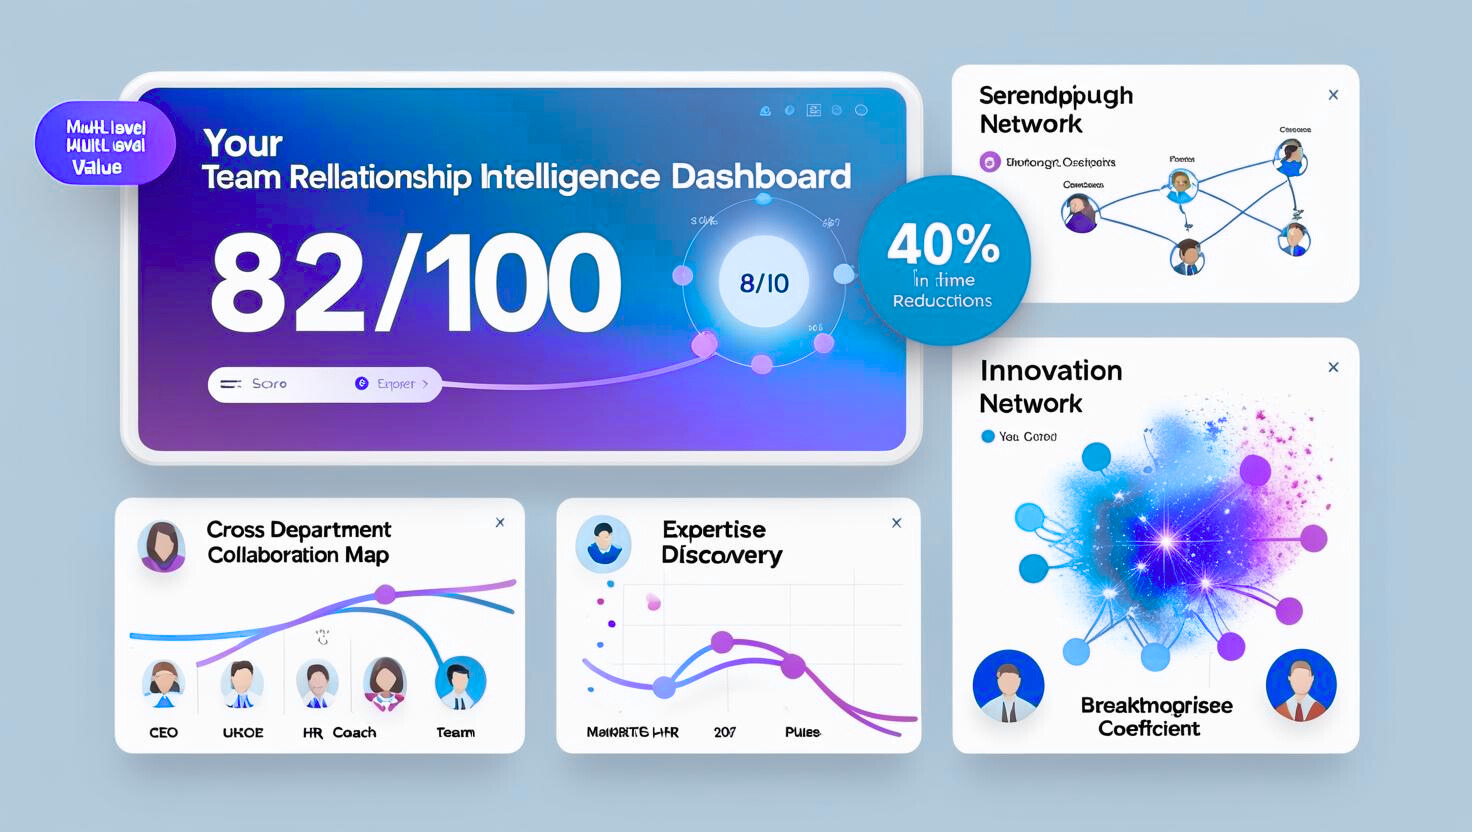
“Team Connection Pulse: 7.2/10 (↑ 15% from last month)”
“Cross-Dept Interactions: 47 conversations this week (↑ 23%)”
2. EXPERTISE DISCOVERY RATE
WHAT IT MEASURES:
- How quickly employees find relevant colleague expertise
- Efficiency of informal knowledge networks
- Breaking down of organizational silos
HOW BUMPCALL TRACKS IT:
- Time from “need” to “expert connection”
- Number of new expertise discoveries per month
- Cross-functional collaboration initiation
BUSINESS IMPACT:
- 40% faster problem resolution when expertise networks are strong
- Reduces external consultant costs through internal knowledge discovery
DASHBOARD VIEW:
“Expertise Connections: 23 new discoveries this month”
“Avg. Time to Find Expert: 2.3 hours (↓ 47% from baseline)”
3. RELATIONSHIP STRENGTH INDEX
WHAT IT MEASURES:
- Quality of professional relationships (not just frequency)
- Sustained interaction patterns over time
- Mutual engagement levels between colleagues
HOW BUMPCALL TRACKS IT:
- Bidirectional conversation patterns (both people engage)
- Conversation depth indicators (duration, follow-up actions)
- Relationship consistency over time
BUSINESS IMPACT:
- Strong relationships correlate with 28% higher employee satisfaction
- Predicts retention better than traditional engagement surveys
DASHBOARD VIEW:
“Team Relationship Health: Strong (85% mutual engagement)”
“Relationship Durability: 78% maintain regular contact after 90 days”
4. SERENDIPITY COEFFICIENT
WHAT IT MEASURES:
- Unexpected professional connections that lead to value
- Cross-departmental surprise discoveries
- Innovation-driving random encounters
HOW BUMPCALL TRACKS IT:
- Connections between previously unconnected colleagues
- Conversations that lead to follow-up collaborations
- “Surprise value” discoveries (expertise in unexpected places)
BUSINESS IMPACT:
- 52% of breakthrough innovations come from serendipitous professional interactions
- Competitive advantage through internal connection discovery
DASHBOARD VIEW:
“Serendipitous Connections: 12 this month (3 led to new projects)”
“Surprise Expertise Discoveries: 8 colleagues with unexpected skills identified”
🔒 PRIVACY-FIRST MEASUREMENT APPROACH
What We DON’T Track:
❌ Individual conversation content
❌ Personal performance scoring
❌ Individual surveillance or monitoring
❌ Private information or personal details
❌ Competitive rankings between employees
❌ Punitive metrics or negative scoring
What We DO Track:
✅ Anonymous, aggregated team patterns
✅ Voluntary participation rates
✅ System usage that indicates relationship building
✅ Business outcomes correlated with connection quality
✅ Team health indicators (not individual ratings)
✅ Positive relationship indicators only